Dashboard
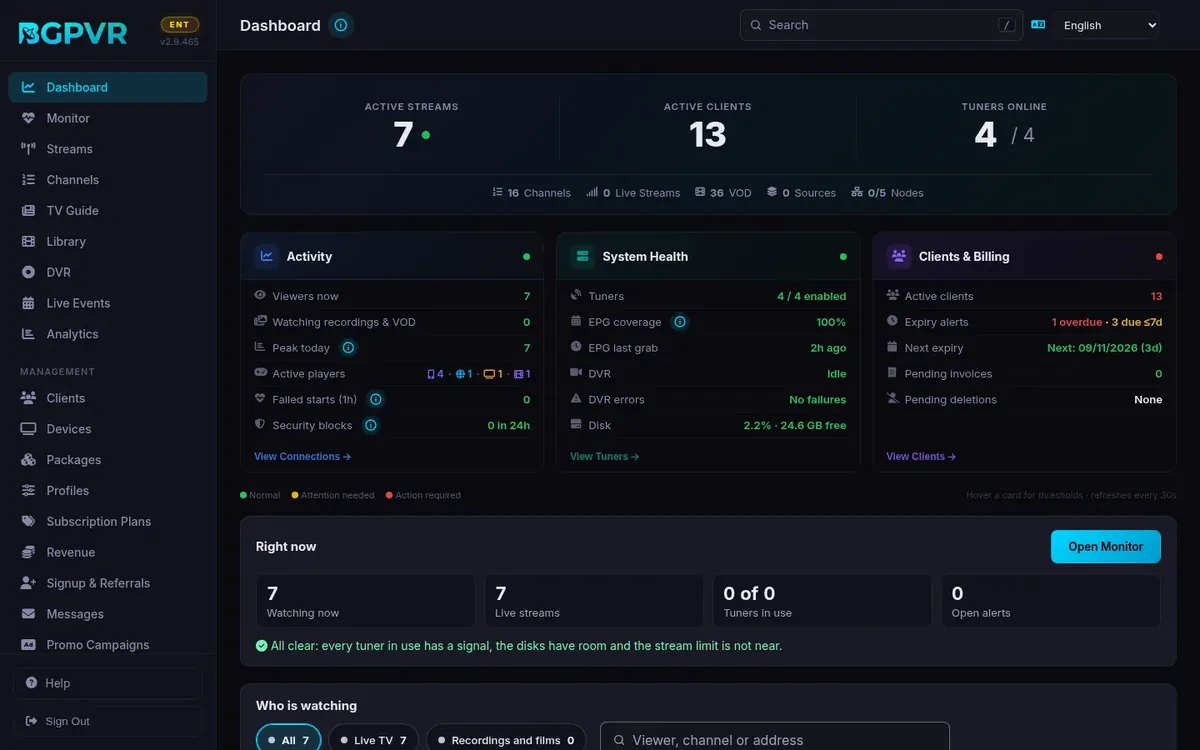
The first screen: what is happening now and what needs you, as widgets you arrange yourself (2.9.478): the hero numbers, Activity, System health, Clients & billing, Right now, Who is watching, Recent activity, New registrations and Apps & stores, plus Monitor and Analytics widgets. Right now and Who is watching refresh every 15 seconds, the rest every 30 seconds.
On this page
- Search the console (2.9.453)
- Arrange the Dashboard with widgets (2.9.478)
- Which widgets you can add
- Read the hero and the three cards (2.9.478)
- Read the app versions per store (2.9.478)
- Where Active Streams went (2.9.402)
- Who is watching on the Dashboard too (2.9.406)
- Find the complaining subscriber and judge their stream
- See who is watching a recording or VOD
- Read the stream diagnostics drawer
- See what a user in Recent Activity watched
- Prove whether the fault is the source or the viewer
- Kick a stuck session
- Record what is on air right now
- Scan the three KPI panels
- Recent activity and New registrations (2.9.476)
- Why a channel did not start (2.9.482)
- Watch out
Search the console (2.9.453)
The box at the top of every page, left of the language picker, finds pages, settings, actions, clients, channels, packages, recordings, films, series, devices and this guide. Press / (or \, or Ctrl+K / Cmd+K) anywhere the cursor is not in a field, type at least two letters, move with ↓ ↑ and press Enter. An account number finds that client first (999031 or #999031); a MAC works with or without colons; a digits-only search lists clients and devices first. Each group shows 5 results, then "Show all N" opens that list page filtered by what you typed. Esc clears the text, a second Esc closes the box. A Help result opens this guide in a new tab at that section.
You only see what your role can open: a staff login without Manage Clients gets no client results, devices need Remote help, settings need the admin or Manage Settings, and the account number of a device's owner shows only with Manage Clients. E-mail addresses are masked unless the address itself matched. The search is not stored on the server; the last few pages, settings and actions you opened are kept in this browser only (never a client).
On a phone, tap the magnifier in the top bar: the search covers the screen and Back closes it.
Arrange the Dashboard with widgets (2.9.478)
Every block on the Dashboard is a widget. Press "Edit dashboard" at the top (in the header bar, just before Search; the pencil button on a phone): each widget gets a bar with ⠿ (drag it to a new place, or focus ⠿ and use the arrow keys), ↑ ↓, S / M / L (one, two or three columns wide; always one column on a phone) and × (remove). "+ Add widget" opens a panel with three sections, Dashboard, Monitor and Analytics; Add puts the widget at the end. Up to 16 widgets. "Reset to default" brings back the standard set and order. Press "Done" to leave. Every change is saved at once for your login only, on the server, so it follows you to another browser. An admin can press "Copy my layout to everyone": every login, including logins made later, then opens that layout and can still change their own. Only widgets on the page read data, and only while they are on the screen.
Which widgets you can add
Dashboard: the hero numbers, Activity, System health, Clients & billing, Recent activity, New registrations, Apps & stores. Monitor: Right now and Who is watching (the Live events panel stays above the widgets while something is on air). Analytics: Headline, Daily activity, Watch activity by hour, Top channels, Platform & devices, Player apps, User activity breakdown, Security events, DVR usage, VOD & series usage (each for the last 7 days) and Today. A locked widget shows its name and one line why: Analytics widgets need the Advanced Analytics module and an admin login; Clients & billing and New registrations need the Manage clients permission (a staff login without it no longer sees the Clients & billing card).
Read the hero and the three cards (2.9.478)
The hero shows Active streams, Active clients and Tuners enabled (switched-on tuners out of all; "Tuners online" before 2.9.478 counted the same), then channels, live streams, VOD, sources and nodes; point at, focus or tap "N nodes" for the licence limit ("unlimited" when there is none). Each card has one line in words: "All normal", or what needs you, for example "7 failed starts in the last hour". Only a row with a problem is coloured, amber for attention and red for action. A dotted label shows its thresholds when you point at it, focus it or tap it.
Read the app versions per store (2.9.478)
One tile per store: Google Play (with open, closed and internal testing), Website /app · Fire TV, Linux (GitHub, apt, Snap), Apple iPhone / iPad, Apple TV, Kodi, LG webOS, Samsung and Vidaa. Each tile has a state (Live, In review, Testing, In progress, Not started), the live version, what comes next, a date and where the line comes from: "auto" when the License server reads the store itself, "typed on the License server" with the day it was typed (amber when it is older than 14 days). The header folds the tiles to one line; the Dashboard remembers it for your login. On an operator's suite the widget is read-only: the version people get in each store. If the License server could not be read for more than 3 hours the footer says so in amber.
Where Active Streams went (2.9.402)
The Active Streams table moved to Monitor › Now › Who is watching: the same rows, Details opens the same diagnostics drawer, Kick is now Stop. The tasks below about the stream table, the drawer, Check source signal and recording what is on air are done there. In its place the Dashboard has "Right now" (watching now, live streams, tuners in use, open alerts, the first 3 alerts, Open Monitor) and, while an alert is open, a notice at the top: "N problems need you — Open Monitor". It refreshes every 15 seconds.
Who is watching on the Dashboard too (2.9.406)
Under "Right now" the Dashboard shows Monitor's Who is watching card: the same filters (All / Live TV / Recordings and films), Find, Details and Stop as in Monitor › Now, 10 rows at a time ("Show 10 more"). It refreshes with the Dashboard every 15 seconds. Staff logins see shortened addresses here too, and Stop needs the Manage clients permission. With nobody watching, the card is one line.
Find the complaining subscriber and judge their stream
Scroll to "Active Streams Snapshot". Find the row by the "User" column. Read "Health": green "OK" means the server has never had to drop a chunk for that session; "N drops" is amber up to 50 and red above 50 (hover the badge for "Last drop: <time>"). "Transferred · Speed" is bytes sent plus the bitrate the console derives between two 4s polls. Click the row to open the stream diagnostics drawer.
See who is watching a recording or VOD
Since 2.9.316 the Active Streams Snapshot also lists people watching a recording, a film or a series, below the live streams: the title and kind, the user (and profile), the device, a red Recording or teal VOD badge, the IP address, the position with a progress bar, how long they have been watching and "Not counted in the stream limit". These rows have no kick button and do not open the diagnostics drawer. The Activity panel counts them on its "Watching recordings & VOD" row.
Read the stream diagnostics drawer
Clicking a row shows: User · App, IP address with country flag and a "(local)" or "(remote)" tag, Source (DVB · Adapter N · MHz / Public relay / Direct), Health, Bitrate · Sent, then a coloured verdict line (green healthy, amber = server clean but viewer is remote, red = server is dropping chunks). Below: "Tuner signal — Adapter N" (DVB only, and only if that adapter is in the tuner list) with Signal quality, Carrier-to-noise (C/N), Signal strength, Frontend lock; "Session" with Watching for, Delivery mode, DVB IDs (SID/MUX/TS), User agent; "Connections" with Active for this user (count / their max_connections, red at the limit) and Also watching. Buttons: "Check source signal" and "Edit user".
See what a user in Recent Activity watched
Every account name in Recent activity, in Who is watching and in the Details window is a dotted-underlined link to the viewer summary (Monitor › Open a viewer's summary). Only existing subscriber accounts are links: "system" lines, deleted accounts and anonymous sessions stay plain text. The links appear for an admin login on a licence with Advanced Analytics; staff see plain names.
Prove whether the fault is the source or the viewer
In the drawer press "Check source signal". The server pulls up to ~6 seconds (or 16 MB) of that channel through the same internal play.ts path a viewer uses, then reports Result (Source is clean / Source has errors), Transport errors (tsp analyze), Corrupt packets (ffmpeg), Delivery rate in Mbps and Video codec · resolution. Source clean plus drops on the viewer row means the client or its network is the problem, not your feed.
Kick a stuck session
On the stream row click the ban icon (far right) and confirm "Kick" in the "Kick Stream" dialog. The row is archived to watch history (only if it lasted ≥10s and had a channel) and deleted from active_connections. Use it when a ghost session is holding one of a user's connection slots.
Record what is on air right now
On a stream row whose channel is mapped, click the record (vinyl) icon. It looks up the channel's current EPG programme and creates a DVR timer from now until that programme's end; with no EPG data it creates "Manual Recording: <channel>" for one hour.
Scan the three KPI panels
Activity: Viewers now, Watching recordings & VOD, Peak today, Active players (per-player icon counts), Failed starts (1h), Security blocks ("N in 24h"). System Health: Tuners ("N / M enabled"), EPG coverage, EPG last grab, DVR, DVR errors, Disk. Clients & Billing: Active clients, Expiry alerts, Next expiry, Pending invoices, Pending deletions. Each panel has a green/amber/red dot and a footer link — View Connections, View Tuners, View Clients.
Recent activity and New registrations (2.9.476)
Recent activity reads as sentences, the person first ("dimityr65 signed in to My Account"), each with one tag: Errors, Watching, Recordings, Accounts or Security. The chips filter by kind and show how many of each. Errors: a channel that does not start (how many tries and how many viewers tried it meanwhile), a recording that failed (the reason and how many clients lost it) and an error report sent from an app (device and version); "Open →" goes to the channel, the recording or the report. A person's repeated security events are one row with ×N (click ×N for the list). A known device coming back is not shown, only new places. The tick box above the list hides the lines of the accounts set in Settings › Clients & privacy (on at first; your choice is kept for your login). It also hides the error reports sent by Google's automatic app-testing devices (Firebase Test Lab, known by their published addresses): they are not viewers. Recordings of the ADML training account say "AI training": they only teach the ad-break models. Lines are grouped Last hour / Earlier today / Earlier. New registrations (right, or below on a narrow screen) lists the last 10 accounts registered: how (signed up in My Account, with Google or Apple, an e-mail link, an invite code, or added by staff), the status (Trial, Active, Confirm e-mail, Awaiting payment, Expired, Switched off) and when. Family members are not accounts and are not listed. A row opens the client; "All clients →" opens Clients, newest first. The card needs the Clients right.
Why a channel did not start (2.9.482)
Recent activity says why a tuner channel did not start (for example "No picture from the tuner in 20 s"). A channel that stopped in the middle of watching has its own line, "stopped while playing". When the channel has no backup version the line says so and opens Channels → Versions, where you can add one, so viewers move to it next time.
Watch out
- The banner "Active Clients" and the "Active clients" row of the Clients & Billing panel count the same accounts as the Active chip on the Clients page: status active and not expired (an account on the free package counts; pending, disabled, suspended and expired accounts do not).
/api/system/infostill returns the total of all accounts asclients, next toactive_clients. The panel's "overdue" and "due ≤7d" alerts follow the same rule: an account on the free package is never overdue nor due, and "due ≤7d" counts the same accounts as the "Expiring in 7 days" chip on the Clients page (whole days on the server's calendar). - The banner "Tuners Online" and the System Health "Tuners" row are both the enabled/total adapter count from the dvb_adapters table, not tuners that have signal lock. Open Monitor › System for real lock state.
- "Peak today" is not peak concurrency — it is COUNT(DISTINCT client_id) from watch_events since UTC midnight, i.e. how many distinct accounts started watching today.
- "Failed starts (1h)" counts any watch_events row shorter than 10 seconds in the last hour. Normal channel surfing inflates it; amber above 3, red above 10.
- Kicking is not a ban: the delivery loop re-checks that the connection row still exists about once a second and then stops sending, but a player that auto-reconnects simply opens a new session.
- Opening a page no longer cleans the connection table (2.9.402): a background job every 30 seconds archives a session into the viewing history and deletes it once nothing was heard from it for 3× the stale-connection window (at least 5 minutes), the same rule as the playback reaper, and purges watch_events older than 90 days (a fixed figure; the nightly housekeeping under Backup → Database maintenance applies its own rule, also 90 days by default). A held-up heartbeat during a long database write therefore never ends a live stream.
- "Check source signal" opens a fresh subscription to the channel. If it cannot open the stream or captures under 100 KB you get "Could not capture the source stream." — which on an all-tuners-busy box means the check failed, not that the source is bad.
- The Disk row's colour comes from the alert_disk_threshold setting (default 90%): red at or above it, amber from 10 points below it.
- The red "N pending account deletion(s)" banner above the KPIs jumps to Clients and selects the Pending Deletions tab; it is not dismissible from the Dashboard.
- The legend says "Hover a card for thresholds" but the KPI rows carry no tooltips — the thresholds are only in the dot colour.
- A "Live Events On Air" table appears above the streams table only while an event is broadcasting; when nothing is on air the panel renders empty rather than showing an idle state.
- Apps & stores (2.9.388): the card shows what the License server reports (read every hour): the version people get in each store: Google Play, the website download (/app, also how Fire TV gets the app: Amazon does not list it), the Apple App Store, LG, Samsung and Vidaa. Nothing is edited on the card: store lines and alerts are on the License server. A failed read keeps the last good one and says so. See Settings → Messages → "License server (app versions)".
- Recent Activity groups (2.9.376): a run of the same line one after another (the same event for the same account or stream, e.g. 11 × "Security: source observed — demo" within a few minutes) is one row "… ×11", with the time span under it ("14–17m ago") and the newest time on the right. Click the row or the ×11 (or Tab to it and press Enter or Space) to list its events, each with its time and detail (such as the IP); click again to close it. Only lines next to each other in time merge, so whatever happened in between still shows where it happened. The card shows 20 rows, a group counting as one; a group lists its newest 50 events, then "N more not listed". A single event looks as before, and the account name in a group is still the link to what that user watched.